Analysing Football Events in a Graph Database
- August 30, 2021

As long as I can remember I’ve always wanted to
be a gangsteranalyse sports data.
There’s an interesting intersection between my love for football and data. I loved the movie Moneyball and I’ve read countless books on how data is being used by clubs to improve their on-field performance and recruitment processes. But aside from crunching some basic experiements with key metrics like goals and assists to help pick a fantasy football team for World Cup 2018 I hadn’t ever looked in any more detail.
A couple of months ago, I saw a tweet from Statsbomb with a beginners guide to analysing their data with Python or R. After taking a look at the statsbombpy repo I found that their StatsBomb Open Data repo which has a set of JSON files containing matches, lineups and event data. I starred the repo and went on with my day…
But with the Love Island final dominating my TV, it gave me the perfect insentive to escape and dig a little deeper into the data. There are a few presentations around showing some basic analysis, plotting data on a chart, etc., but as a Neo4j developer, I’ve always seen this as something that could benefit from the Graph Database treatment.
Football Data & Graphs
Over the last few years, I have worked with event data quite regularly in Neo4j. The structure of nodes and relationships lends itself well to event sequences so I was interested to see what could be done with these events.
Looking at the data (and some job descriptions), it looked like the data came from a MongoDB database. So in this case, I would look at Neo4j as an additional data store which would only contain a subset of the data that would be useful to analyse the connections between the data. In this case, it makes sense to chain the event data together and start to look for patterns.
A few quick questions that spring to mind are:
- What sequence of events commonly lead to a goal?
- How do a clubs pressing tactics affect their chance creation ratio?
- How soon after a turnover of play would a goal be scored?
All of these questions could be answered by creating a big linked list of events:
(:Event:Pass)-[:NEXT_EVENT]->(:Event:Carry)-[:NEXT_EVENT]->(:Event:Shot:Goal)This would just take a couple of lines of Cypher to find the right pattern - for example an Interception leading to a Goal.
MATCH sequence = (:Interception)-[:NEXT_EVENT*..999]->(:Goal)
RETURN sequence
LIMIT 1
Importing the data
As all of the files are JSON, these can be loaded in using apoc.load.json. I won’t go into too much detail about the import process, but the import scripts are on Github if you ar interested. Feel free to fork and modify.
00-constraints.cypher- Creates the constraints needed to speed up the import01-competitions.cypher- Imports competition and season data fromcompetitons.json02-matches.cypher- Imports match information including stadium and referee, and creates squads with the data inmatches/{competition_id}/{season_id}/03-lineups.cypher- Creates a link between players, seasons and matches from the data inlineups/{competition_id}/{season_id}/04-events.cypher- Creates event nodes linked to the match and period fromevents/{competition_id}/{season_id}/04b-event-list.cypher- Creates theNEXT_EVENTrelationship between each event in a sequence.
As part of the import, I have added additional labels to Events to make them easier to search. For example, I have taken the event type (Pass, Carry, Shot, etc) and play pattern (From Goal Kick, From Corner, etc) and in some cases added the outcome of the move - in this case searching for all Goal events would be interesting.
{
    "identity": 27023,
    "labels": [
        "Event",
        "RegularPlay",
        "Shot",
        "Goal"
    ],
    "properties": {
        "shotXg": 0.51318437,
        "possession": 58,
        "caption": "Lionel Messi Shot",
        "shotBodyPart": "Left Foot",
        "playPattern": "Regular Play",
        "type": "Shot",
        "second": 2,
        "minute": 33,
        "duration": "P0M0DT0.520052000S",
        "shotOutcome": "Goal",
        "oneOnOne": true,
        "shotTechnique": "Normal",
        "shotType": "Open Play",
        "location": point({srid: 7203, x: 114, y: 35.4}),
        "position": "Right Wing",
        "id": "dcb7134f-d234-48f3-8c12-89ccbe7c7eee",
        "endLocation": point({srid: 7203, x: 120, y: 36.8}),
        "timestamp": "00:33:02.526000000"
    }
}
The Data Model
From a relatively small dataset I managed to generate 3.1M nodes and 10.7M relationships.
A :Match node has a series of :HAS_EVENT relationships to :Event nodes. Each event has a subject, this could be the player who attempted the pass or the goalkeeper that faced the shot. :Event nodes are then linked into a list to allow traversals back and forwards from a particular event.

The :Player, :Appearance and :Squad part of the graph matches the model I’ve used in past Fantasy Football graphs, keeping in mind that I could somehow link the two datasets in the future.
La Liga Data
The data set contains data from every game of Messi’s La Liga career, so I thought that would be a good place to start. La Liga is competition_id number 11, the Open Data goes back to 2004/2005 so there is plenty of information to look at.
| id | name |
|---|---|
| ”11—37" | "La Liga - 2004/2005" |
| "11—38" | "La Liga - 2005/2006” |
| … | … |
| “11—4" | "La Liga - 2018/2019" |
| "11—42" | "La Liga - 2019/2020” |
For berevity, I thought I’d concentrate on the 2019/20 season - competition_id number 11 and season_id number 42.
Goalkeeper Distribution
As Barcelona are a possession team, my first thought was how often the team scored directly from the goalkeeper without the opposition touching the ball. Or more generally, how goalkeeper distribution might lead to a goal. Using the linked list of events, I can find patterns of events that start with goalkeeper distribution (events that contain the GoalKeeper label), and traverse through :NEXT_EVENT relationships until I reach an event node with a :Goal label.
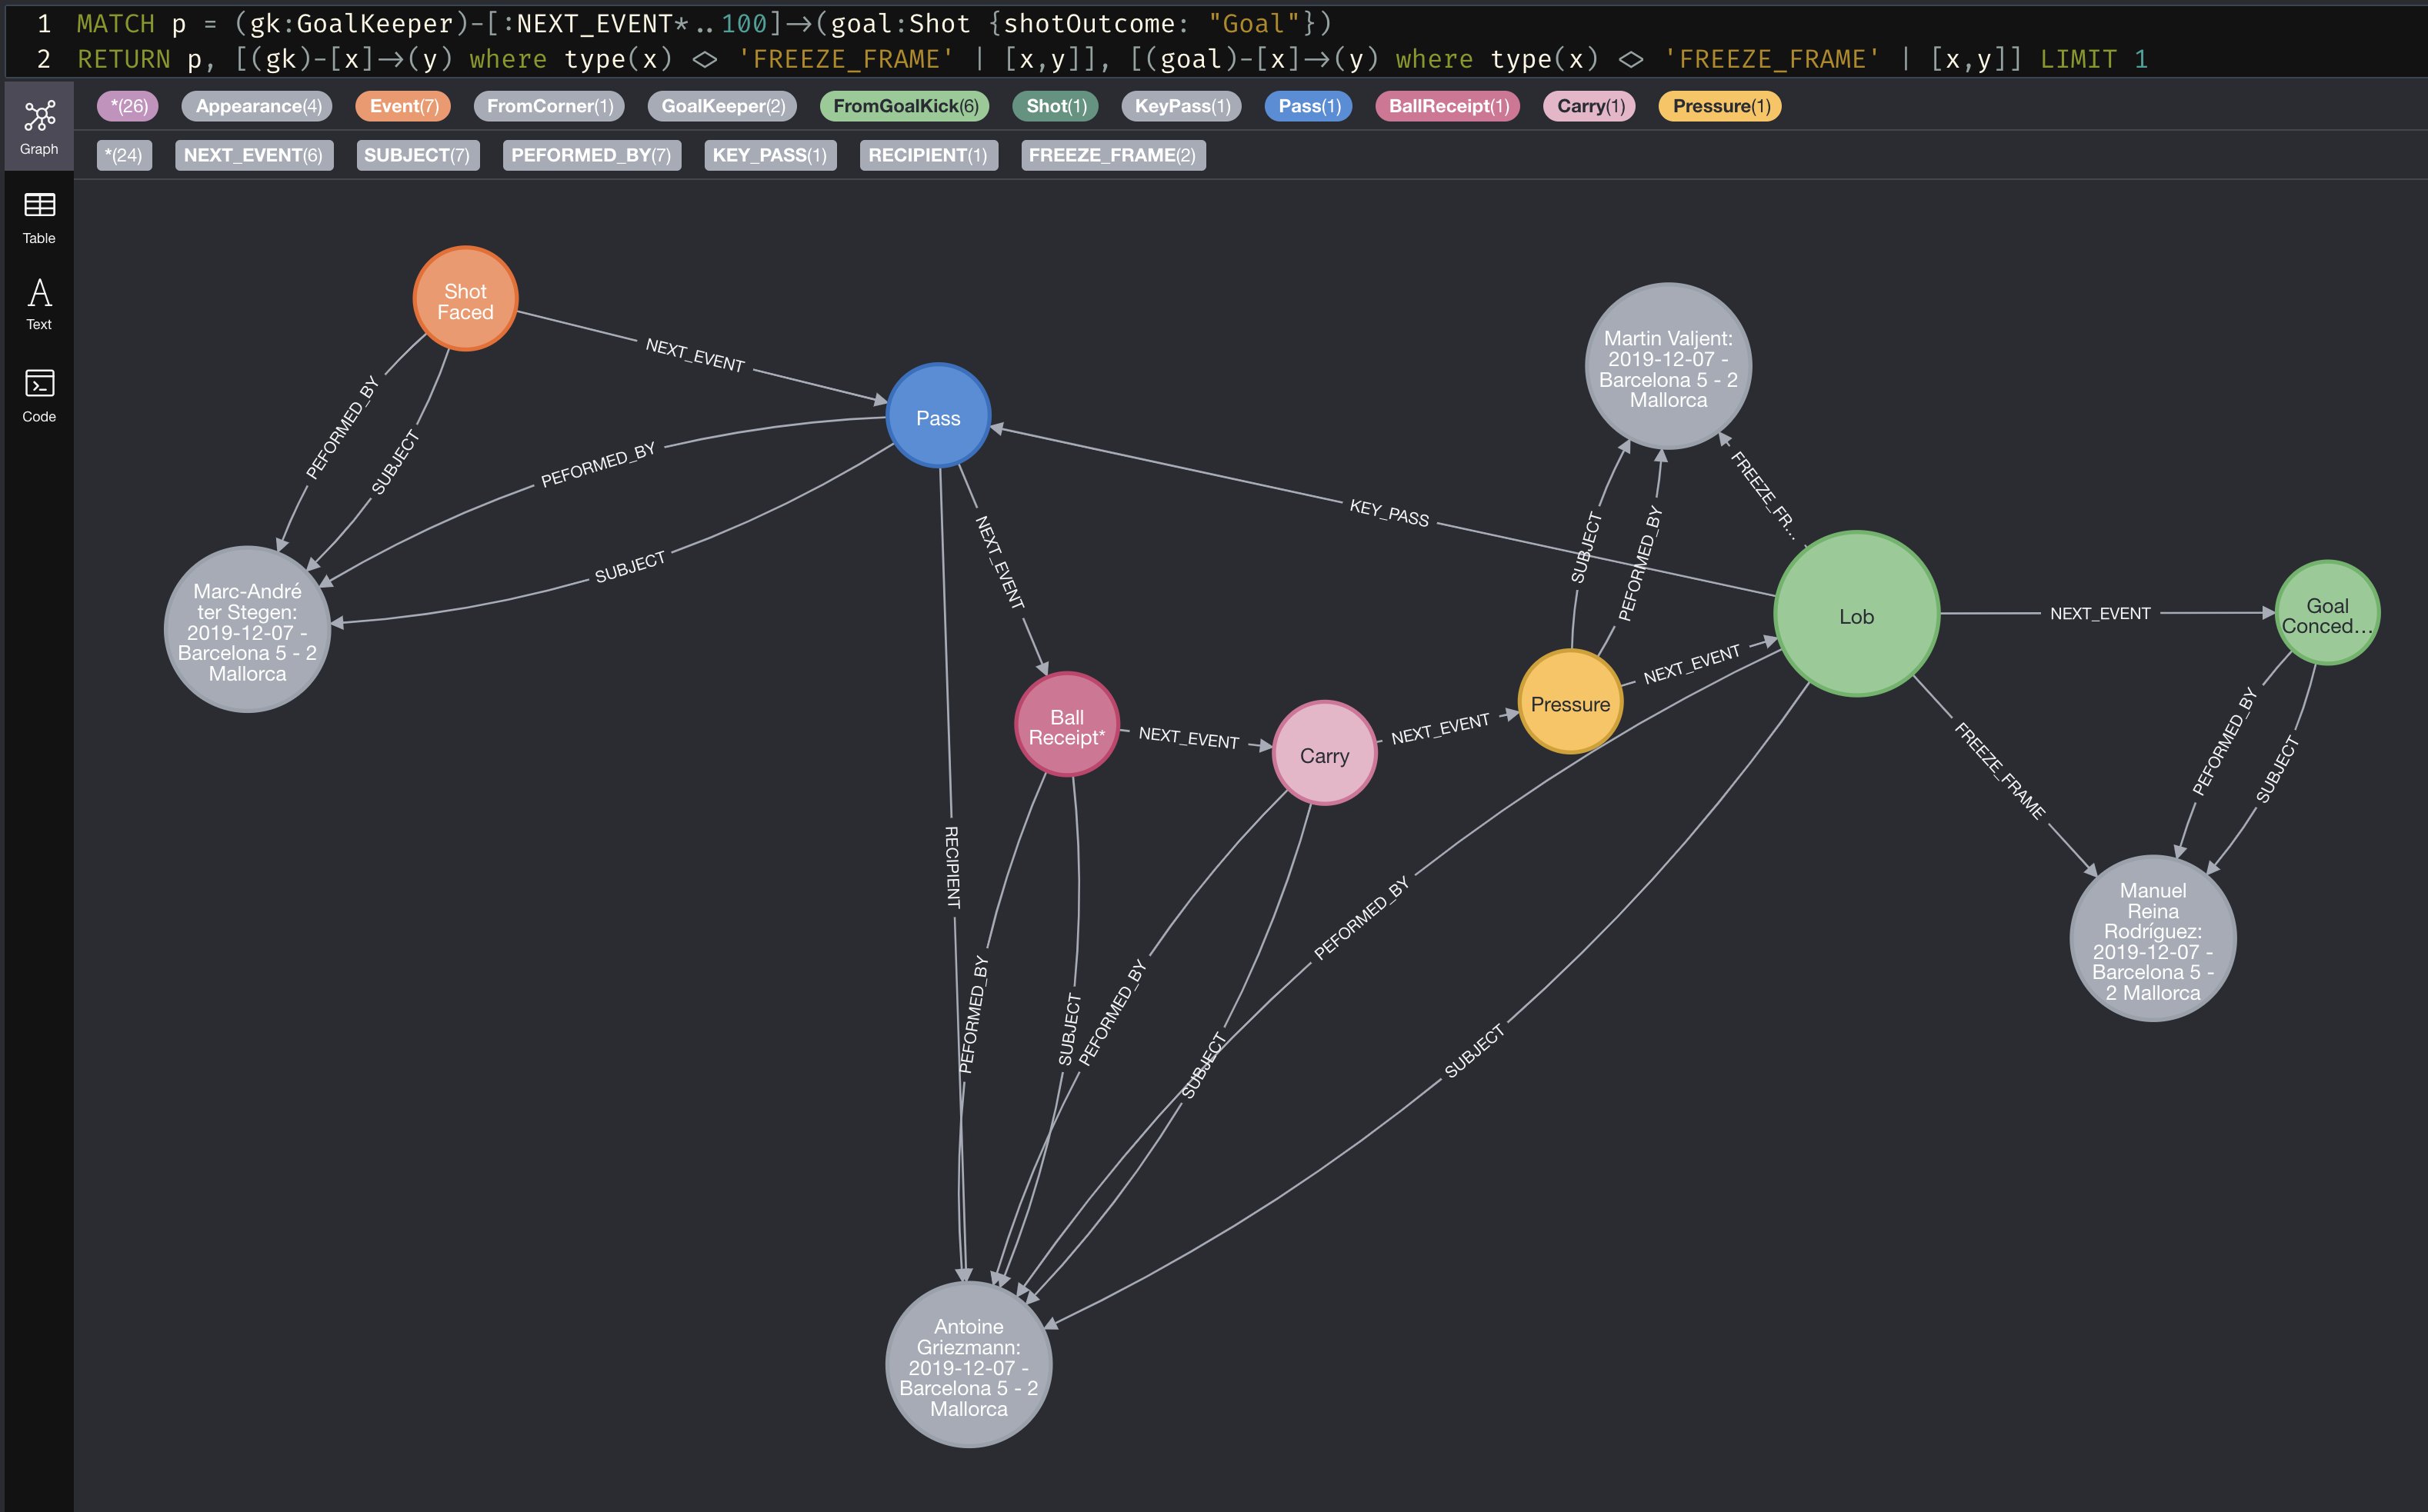
MATCH sequence = (gk:GoalKeeper)-[:NEXT_EVENT*..100]->(goal:Goal)
RETURN sequence
LIMIT 1
Imagine trying to find that pattern with any other technology…
Griezmann vs Mallorca
The first pattern I managed to find was Antoine Griezmann’s goal in a 5-2 win for Barcelona against Mallorca.
In the seventh minute, Marc-André ter Stegen made a save, then quickly hit a 66 yard pass up the pitch towards Griezmann. Despite pressure from the defender Valjent, Griezmann carried the ball into the penalty area and finished with a left-footed lob over Manolo Reina in the Mallorca goal. You can watch the goal here.
Here is how that sequence looks in the Graph:
I got a little bit lucky with that pattern because it was so short. Because all events in a half (or match period) are linked, a goalkeeper event would eventually lead to a goal unless the game ended 0-0. Adding an additional :BY_SQUAD relationship from the event to the team in possession would allow me to filter for patterns where possession didn’t change hands.
MATCH sequence = (gk:GoalKeeper)-[:NEXT_EVENT*..100]->(goal:Goal),
  (gk)-[:BY_SQUAD]->(squad)
WHERE all(n in nodes(sequence) WHERE (n)-[:BY_SQUAD]->(squad))
RETURN sequence
LIMIT 1
Longest Uninterrupted Sequence
What is the longest uninterrupted sequence from distribution to a goal? Well, it’s Luis Suárez’s goal in a 4-0 win over Sevilla on 6 October 2019.

A 51 second long sequence of possession. How do I know this? Each event has a timestamp, so I can use the head and last functions in Cypher to get the first and last nodes within the sequence and calculate the duration between.
MATCH sequence = (gk:GoalKeeper)-[:NEXT_EVENT*..100]->(goal:Goal),
  (gk)-[:BY_SQUAD]->(squad)
WHERE all(n in nodes(sequence) WHERE (n)-[:BY_SQUAD]->(squad))
WITH sequence, nodes(sequence) AS events  ORDER BY length(sequence) DESC
RETURN sequence, duration.between(head(events).timestamp, last(events).timestamp) AS duration
LIMIT 1
Calculating the duration:
WITH duration("P0M0DT51.175000000S") as d
RETURN d.minutes, d.secondsOfMinute| d.minutes | d.secondsOfMinute |
|---|---|
| 0 | 51 |
Deeper Analysis
If I had more time I would probably end up writing a User Defined Procedure to find common patterns in the graph. A procedure that utilised the Traversal Framework would allow me to filter patterns earlier in the query. For example, I could evaluate that all nodes within a sequence of events were performed by the same team as the path is expanded rather than evaluating all patterns at the end of the game.
But to conclude, I have no doubt that Graphs have a big role to play in the analysis of data. Especially in an industry where analyst may not be so computer literate, a single line of Cypher can unearth a complex pattern that would be difficult if looking at the data with another technology.
I’m hoping that I can find the time to explore the data further in the future.